Building an AWS Operations Platform
Building an AWS operations platform using Terraform, Amazon CloudWatch, AWS Systems Manager, Amazon EventBridge and Amazon SNS
Introduction
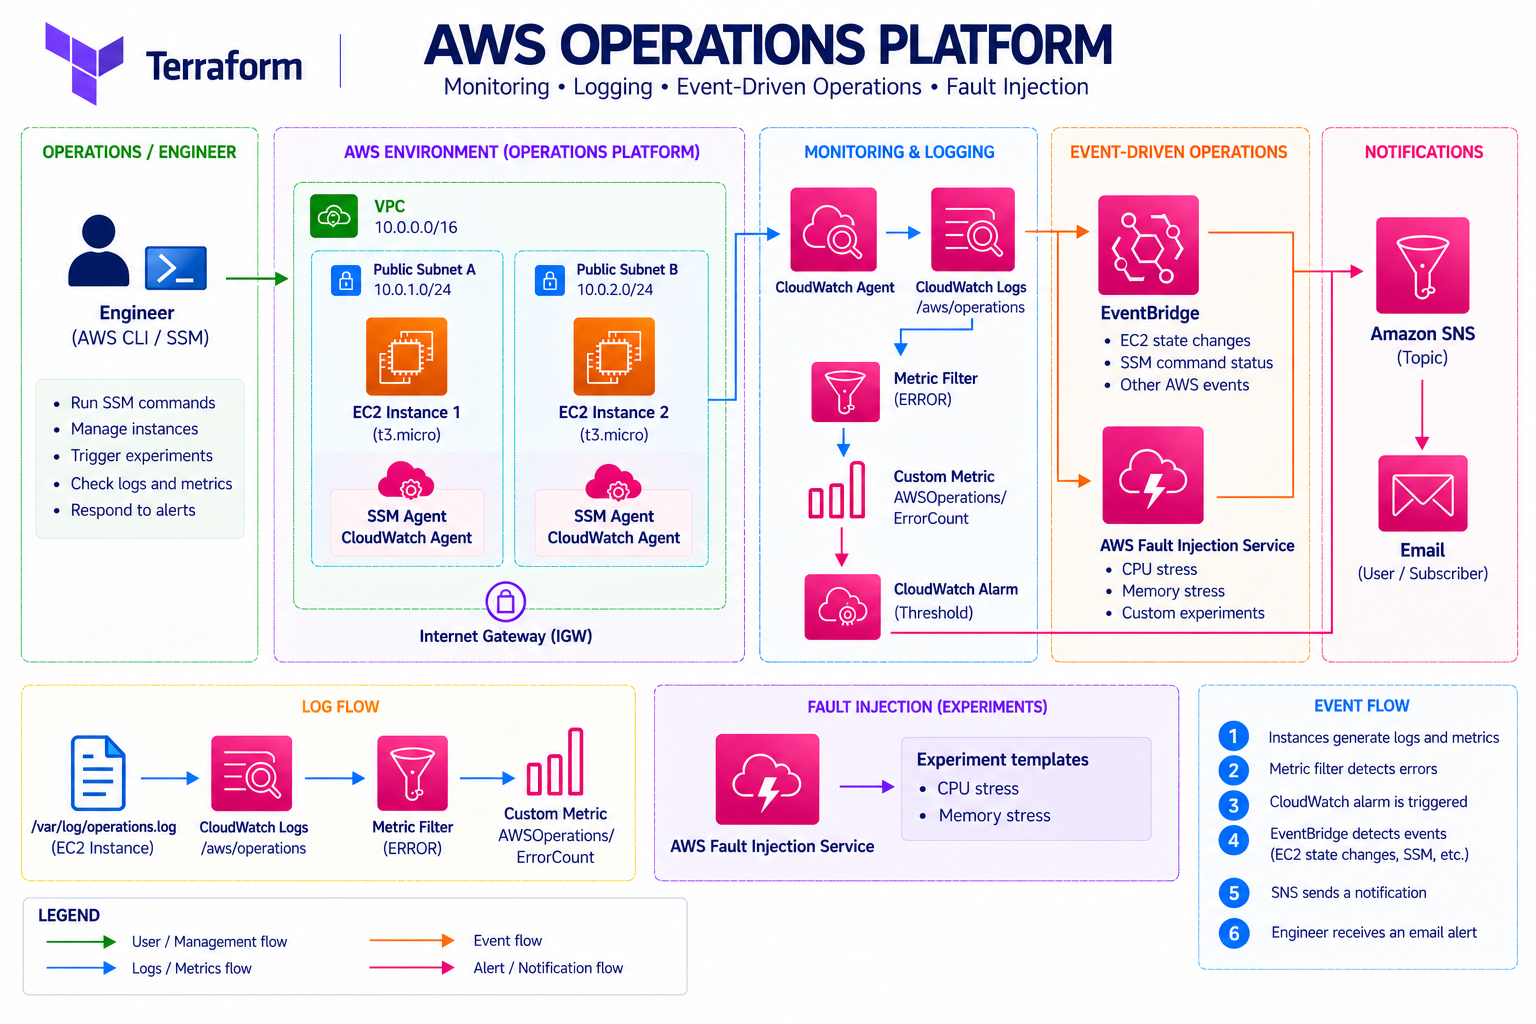
This project was created to build an AWS operations platform focused on infrastructure monitoring, centralized logging, alerting, and event-driven operational management.
The objective was to create a practical environment where operational events could be detected, processed, and reported automatically using native AWS services and Infrastructure as Code.
The project also includes controlled failure and stress testing to validate the monitoring and alerting pipeline under realistic operational conditions.
Services Used
- Amazon EC2
- AWS Systems Manager
- Amazon CloudWatch
- Amazon EventBridge
- Amazon SNS
- AWS Fault Injection Service
- AWS Identity and Access Management (IAM)
Architecture
Configuration
1. CPU Stress Test with AWS Fault Injection Service
The first validation test focused on generating controlled CPU load on an EC2 instance and verifying that the monitoring and alerting pipeline reacted correctly.
The test was performed using AWS Fault Injection Service (FIS), Systems Manager, and Amazon CloudWatch.
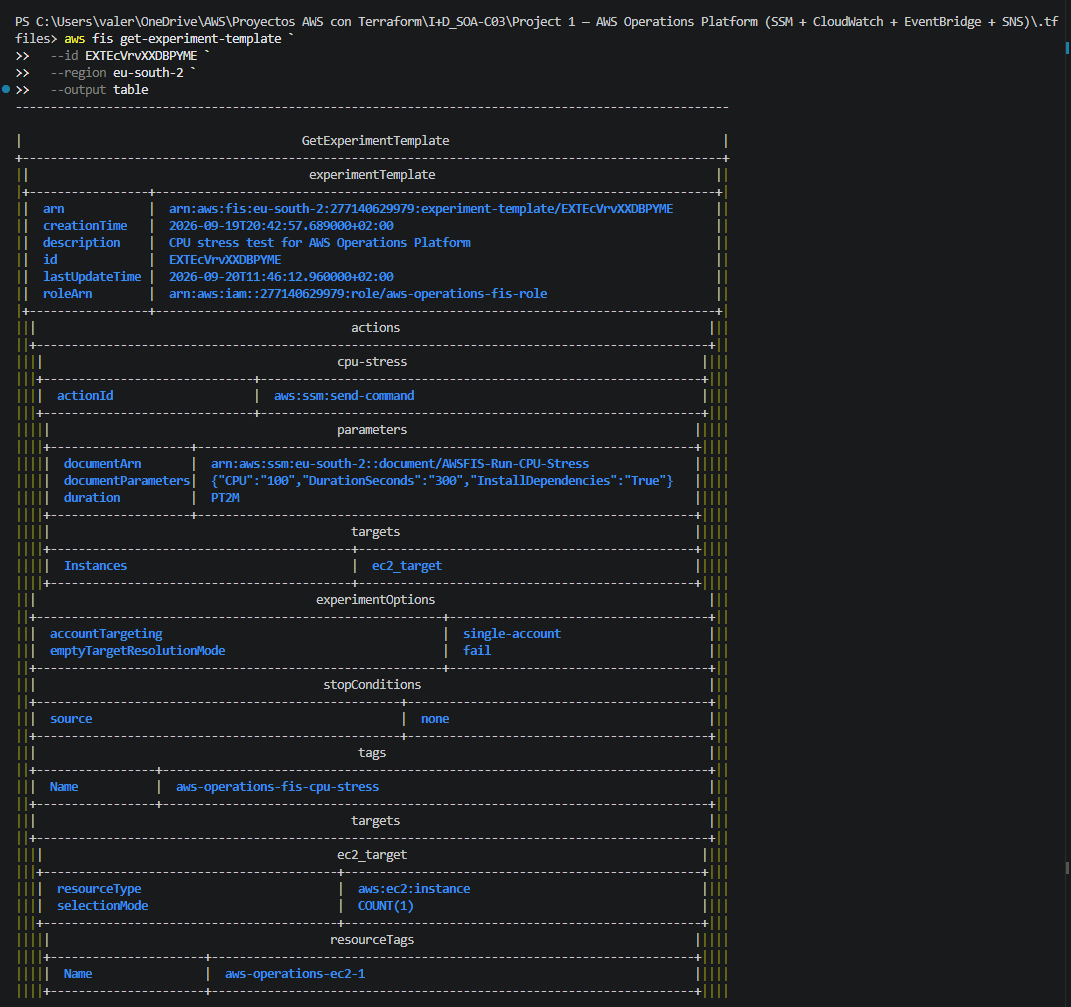
1.1. FIS Experiment Template
The CPU stress experiment template was deployed as part of the Terraform infrastructure.
The template uses the AWS-provided AWSFIS-Run-CPU-Stress Systems Manager document and targets the EC2 instance.
The configuration applies 100% CPU stress for 300 seconds.
The experiment template was first verified to confirm that it was correctly created and available.

The template was then inspected to verify its configuration.
The configuration confirmed the use of:
AWSFIS-Run-CPU-Stress- CPU stress:
100 - Duration:
300seconds - Target: EC2 instance
- AWS FIS IAM role
1.2. Verify No Active Experiments
Before starting the test, the account was checked to confirm that there were no active FIS experiments.
No active experiments were returned, confirming that the environment was ready for the test.

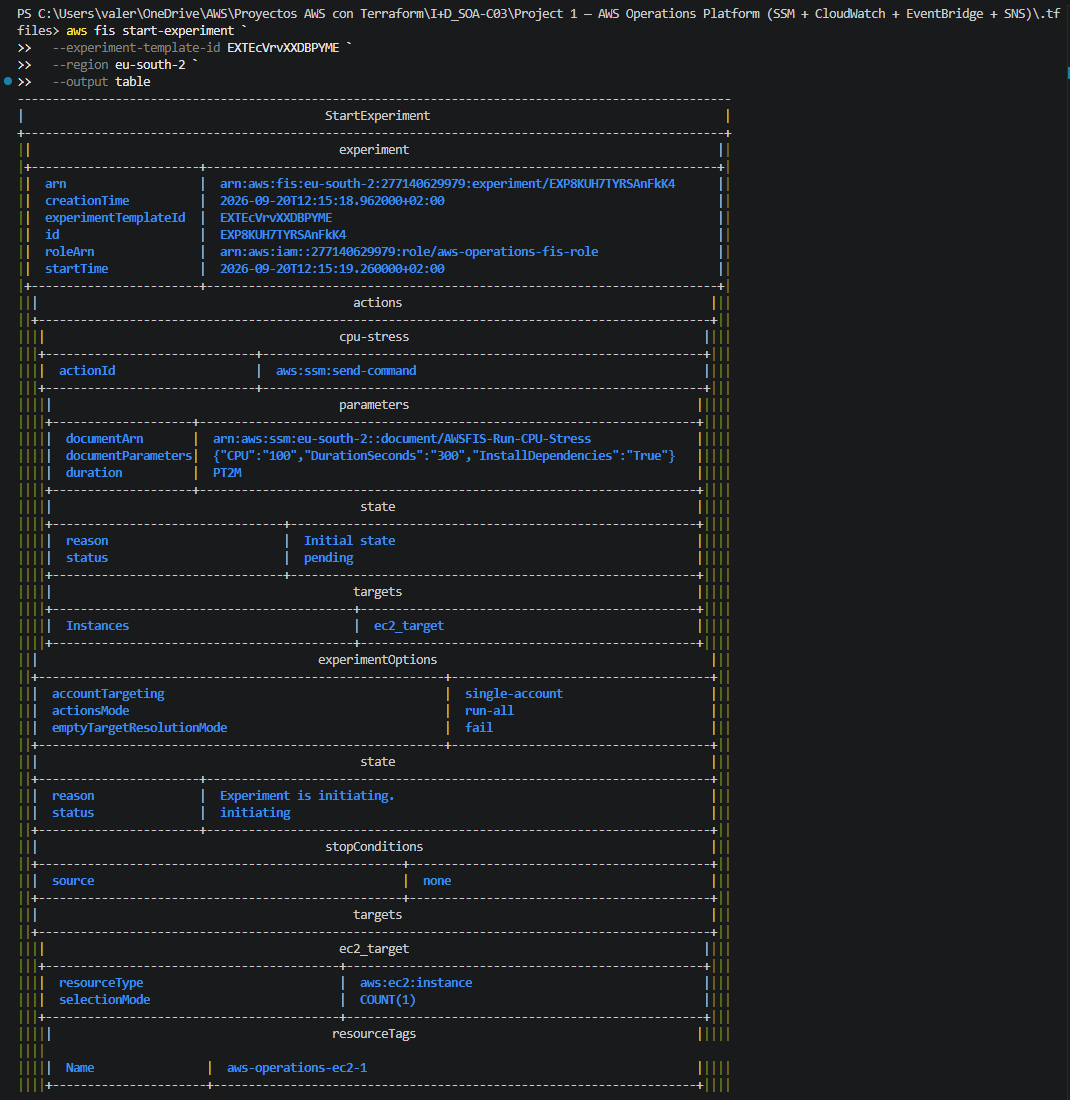
1.3. Start the FIS Experiment
The CPU stress experiment was then started using the previously created experiment template.
AWS FIS created a new experiment and initially reported the experiment as initiating.
1.4. Verify the FIS Experiment
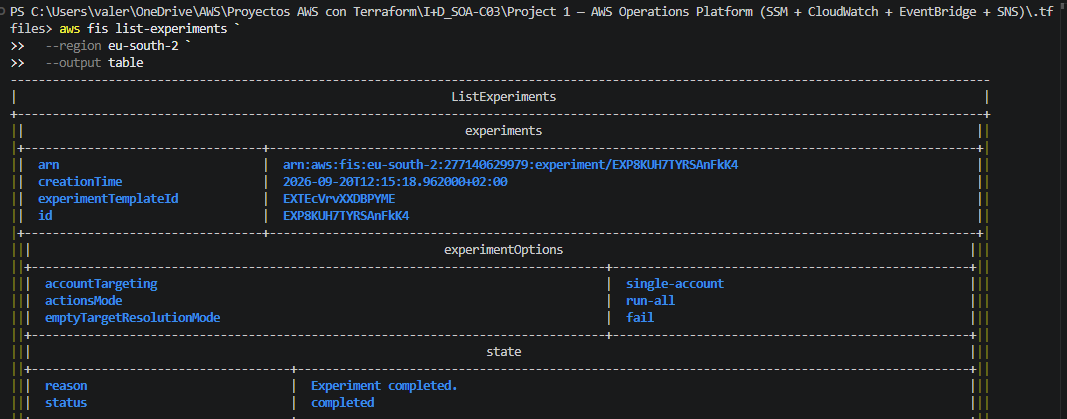
The experiment was then checked to verify its execution state.
The experiment was successfully created and associated with the configured CPU stress experiment template.
The experiment subsequently completed successfully.
1.5. Verify the SSM Execution
AWS FIS uses Systems Manager Run Command to execute the CPU stress action on the target EC2 instance.
The resulting SSM command invocation was checked to verify that the AWSFIS-Run-CPU-Stress document was executed successfully.
The execution completed successfully on the target EC2 instance.

1.6. Verify CPU Utilization
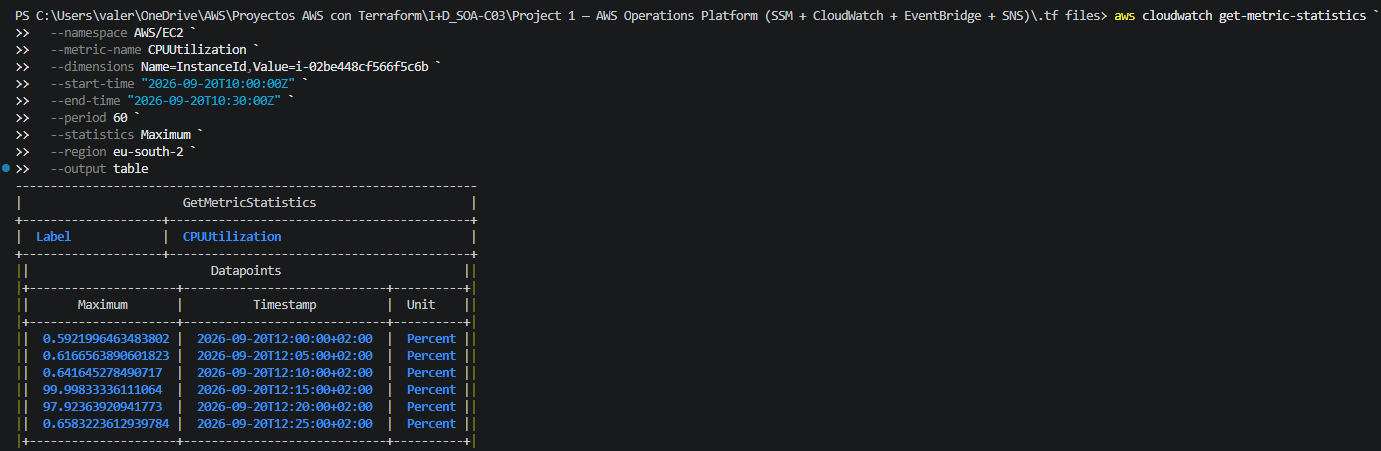
After the experiment was executed, the EC2 CPU utilization metrics were checked in Amazon CloudWatch.
The results show the expected increase in CPU utilization during the FIS experiment.
The CPU utilization reached approximately 100% during the stress test, confirming that the experiment generated the expected load.
1.7. Verify the CloudWatch Alarm
The EC2 instance was monitored by the aws-operations-ec2-cpu-high CloudWatch alarm.
The alarm was configured to trigger when CPU utilization exceeded 70%.
The alarm history confirmed that the alarm changed from OK to ALARM during the CPU stress experiment.

1.8. CloudWatch Alarm Visualization
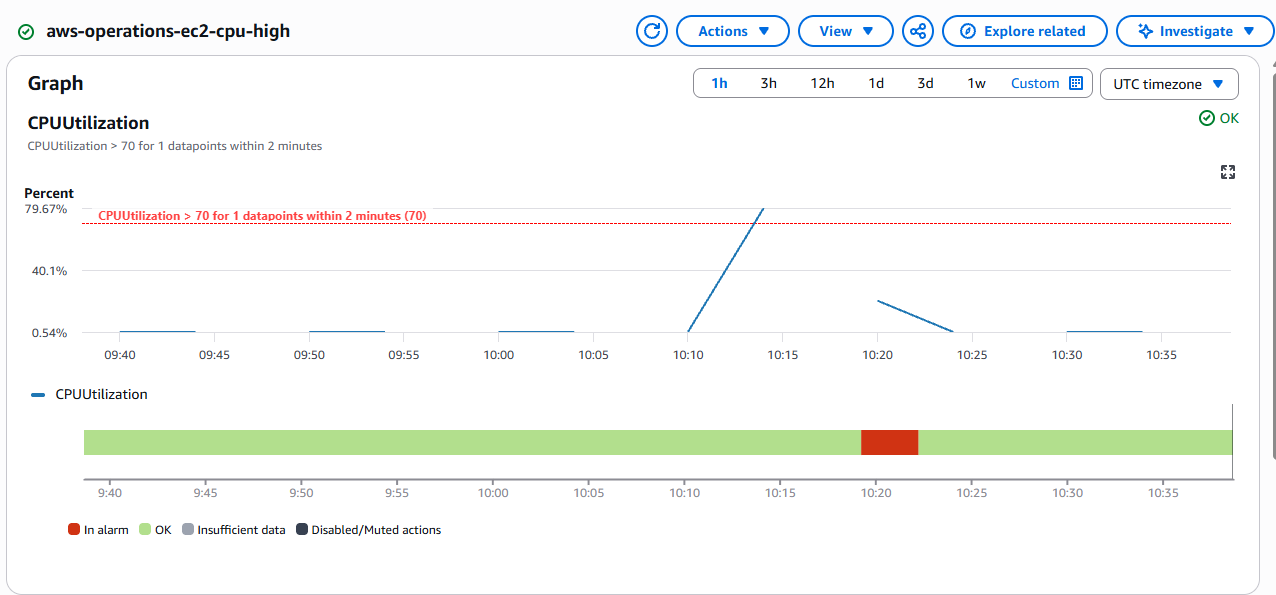
The CloudWatch alarm graph provides a visual representation of the CPU utilization during the test.
The CPU utilization exceeded the configured 70% threshold during the FIS experiment, causing the alarm to enter the ALARM state.
After the stress period ended, CPU utilization returned to normal levels and the alarm returned to OK.
1.9. Test Result
The CPU stress test successfully validated the complete monitoring path:
AWS FIS → SSM Run Command → EC2 CPU Stress → CloudWatch CPUUtilization → CloudWatch Alarm → ALARM state
This test confirmed that controlled infrastructure stress can be generated with AWS FIS and detected automatically by the CloudWatch monitoring and alerting configuration.
2. Memory Usage Monitoring with CloudWatch Agent
To monitor memory usage on the EC2 instances, the CloudWatch Agent was installed and configured to publish memory metrics to CloudWatch.
The mem_used_percent metric was then used to validate memory consumption during a controlled stress test with AWS Fault Injection Service (FIS).
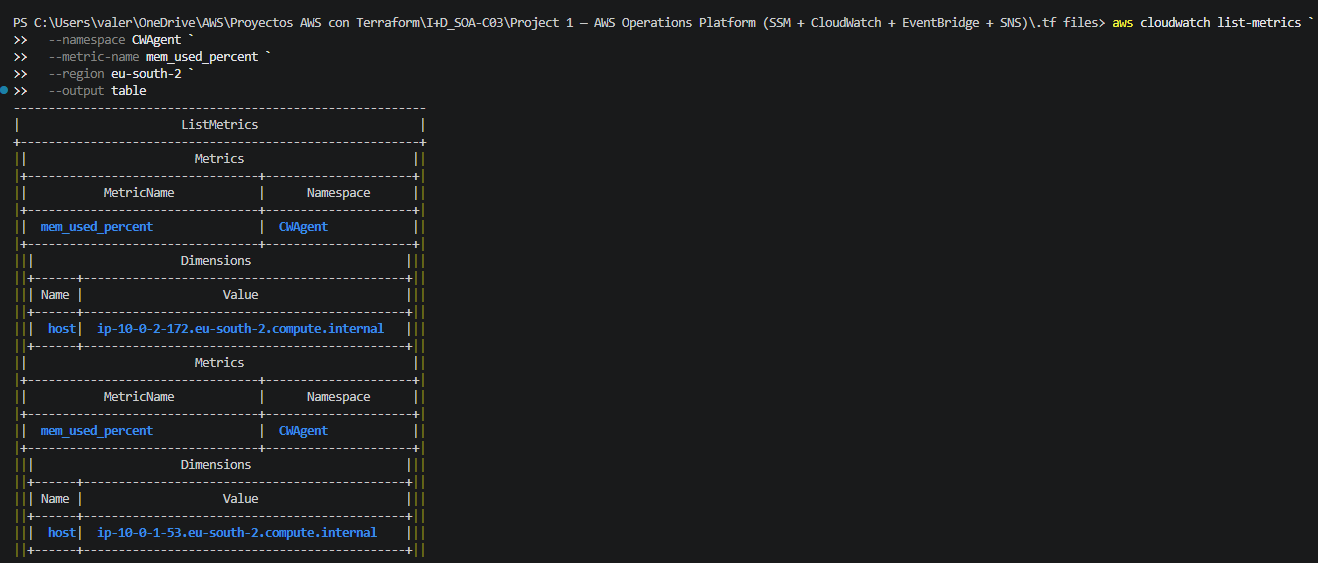
2.1 Verify Memory Metrics
The CloudWatch Agent publishes the mem_used_percent metric under the CWAgent namespace.
This confirms that memory usage is being collected from the EC2 instances and is available in CloudWatch.
2.2 Create the Memory Stress Experiment
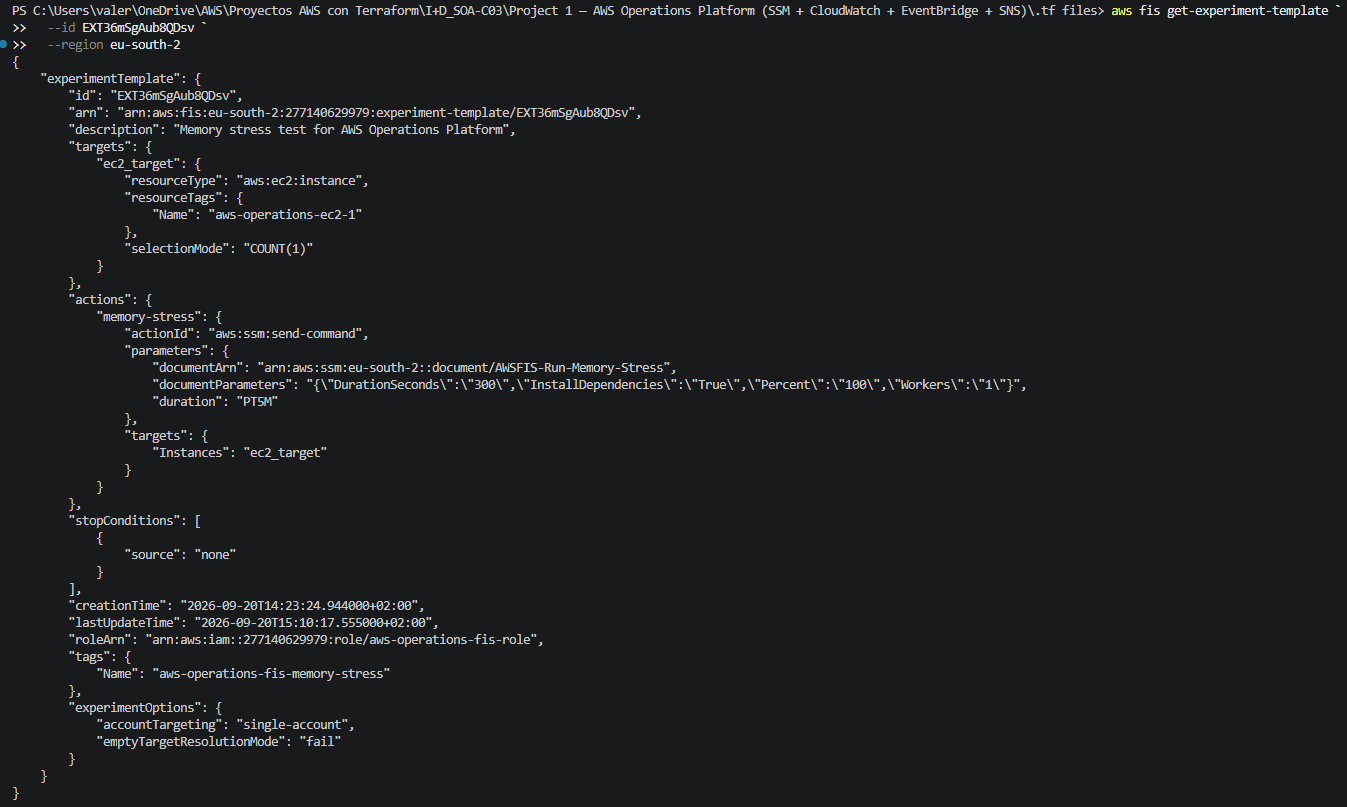
An AWS FIS experiment template was created to generate controlled memory pressure on the target EC2 instance.
The experiment uses the AWSFIS-Run-Memory-Stress SSM document with 100% memory usage for 5 minutes.
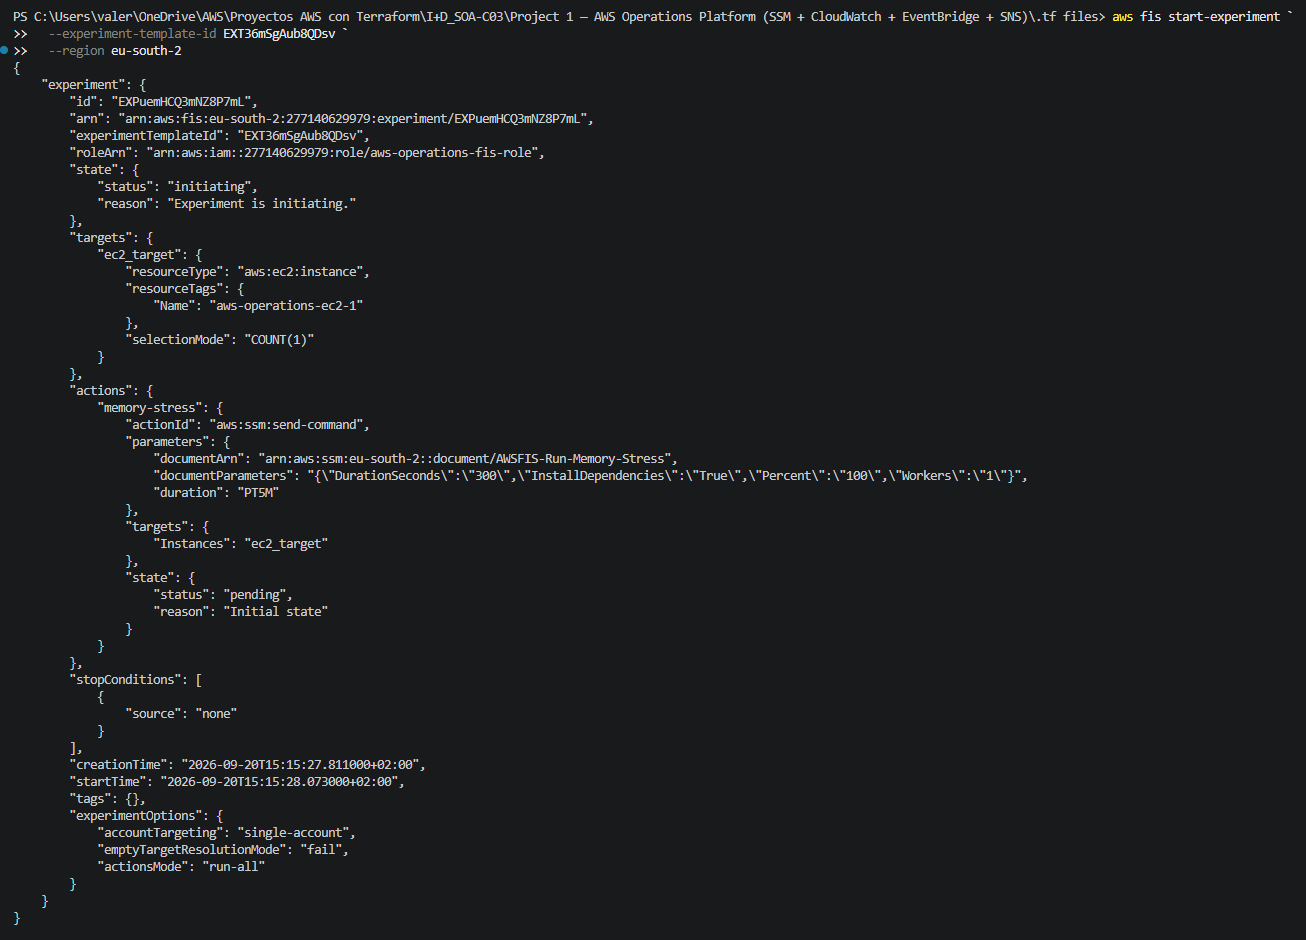
2.3 Start the Experiment
The FIS experiment was started against the EC2 instance selected by its resource tag.
The experiment initially enters the initiating and pending states before executing the defined stress action.
2.4 Monitor the Experiment
The experiment was checked while running to confirm that the memory stress action was being executed against the target instance.

2.5 Confirm Experiment Completion
After the configured duration, the FIS experiment completed successfully.
This confirms that the memory stress action was executed as expected.

2.6 Validate Memory Usage
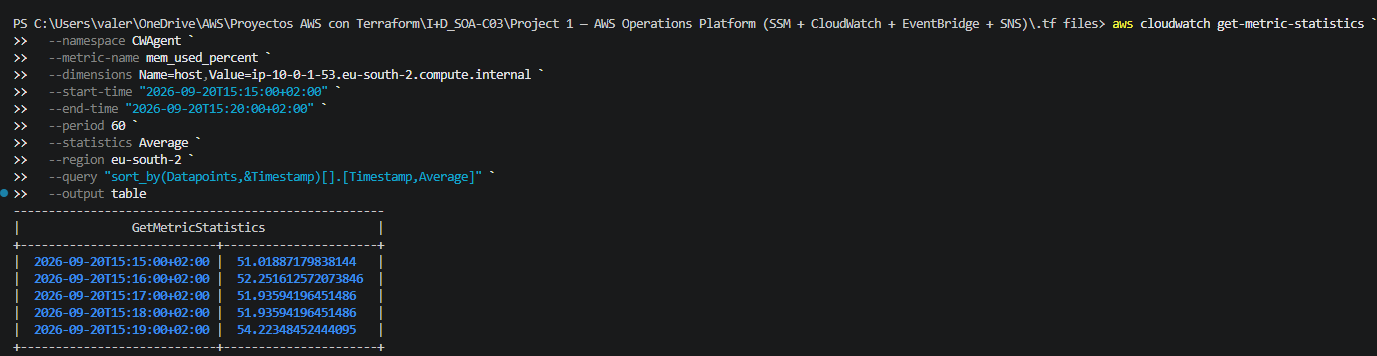
Finally, the mem_used_percent metric was queried from CloudWatch to verify the memory usage recorded during the experiment.
The FIS experiment was configured with Percent = 100, meaning that the stress action attempts to consume up to 100% of the available memory on the EC2 instance.
However, this does not mean that CloudWatch will necessarily report exactly 100% memory usage. The mem_used_percent metric represents the memory actually used by the operating system at the time of measurement. The final value depends on the memory already being used by the system, the resources consumed by the stress process, and how the operating system calculates available and used memory.
Therefore, the value reported by CloudWatch can remain below 100% even when FIS is configured to apply 100% memory stress. In this test, the metric increased as expected, confirming that the memory stress was successfully applied and monitored through the CloudWatch Agent.
3. CloudWatch Metric Filter
Following the previous CPU and memory stress tests with AWS FIS, the next step was to generate controlled operational events and verify that they could be detected through CloudWatch.
These events can then be converted into metrics and used to trigger CloudWatch alarms, notifications, and further automated actions.
For this purpose, a CloudWatch Metric Filter is used to detect specific error patterns in the centralized logs and convert them into measurable metrics.
3.1. Verify the Metric Filter
The first step was to verify that the metric filter was correctly created and associated with the AWSOperations namespace and the ErrorCount metric.

3.2. Generate a Test Error Event
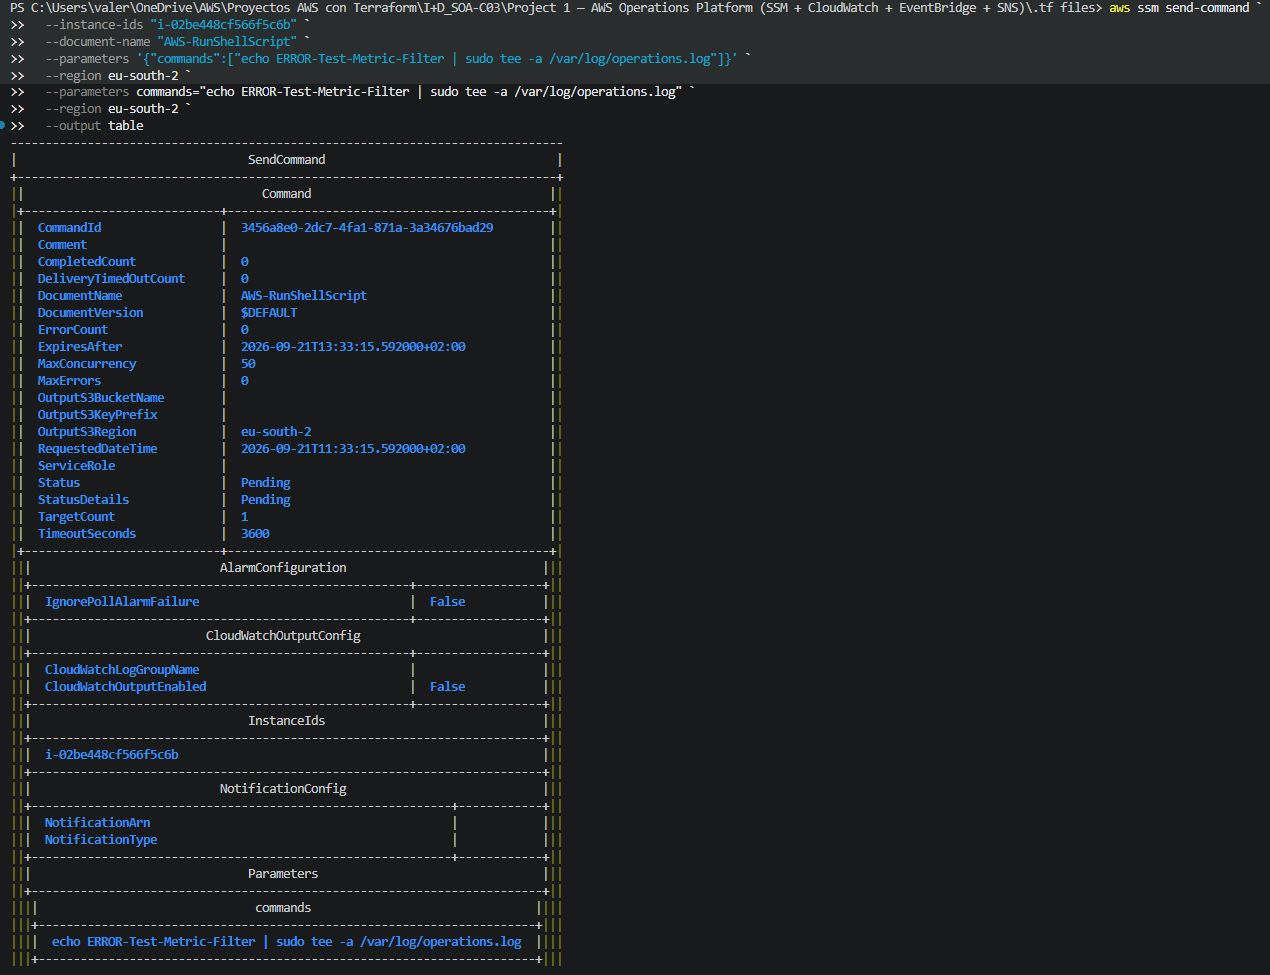
An error message was manually generated on the EC2 instance using AWS Systems Manager.
The test message was written to /var/log/operations.log using the AWS-RunShellScript document.
3.3. Verify the SSM Command Execution
The execution of the SSM command was checked to confirm that the test event was successfully generated on the target EC2 instance.

3.4. Confirm Successful Command Execution
The SSM command invocation returned a Success status, confirming that the test message was successfully written to the log file.
3.5. Verify the Generated Metric
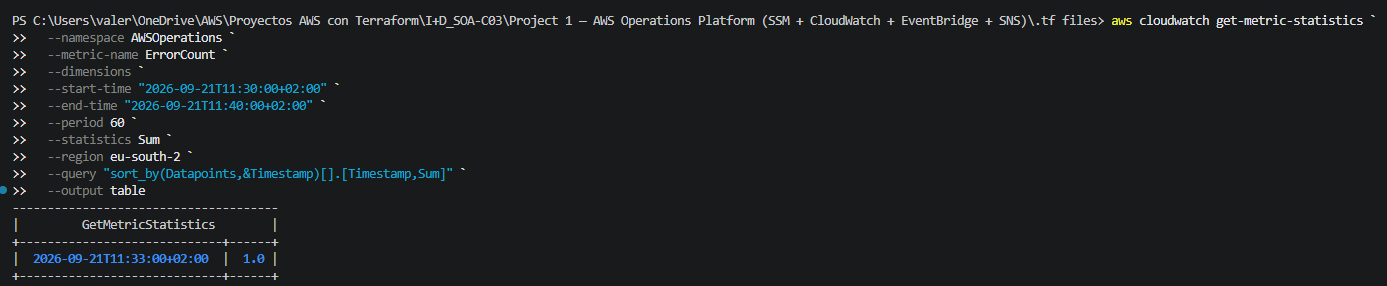
Finally, the ErrorCount metric was queried from the AWSOperations namespace.
The metric returned a value of 1, confirming that the test error was detected by the metric filter and converted into a CloudWatch metric datapoint.
This validates the complete flow:
Log event → Metric Filter → CloudWatch Metric
4. CloudWatch Alarm
Following the previous metric filter implementation, the next step was to use the generated ErrorCount metric to create a CloudWatch alarm.
The alarm monitors the metric and changes its state when the configured threshold is reached, allowing the event to trigger notifications through Amazon SNS.
4.1 Verify the CloudWatch Alarm
The first step was to verify that the aws-operations-errors alarm had been correctly created and associated with the ErrorCount metric in the AWSOperations namespace.

4.2 Generate a Test Error Event
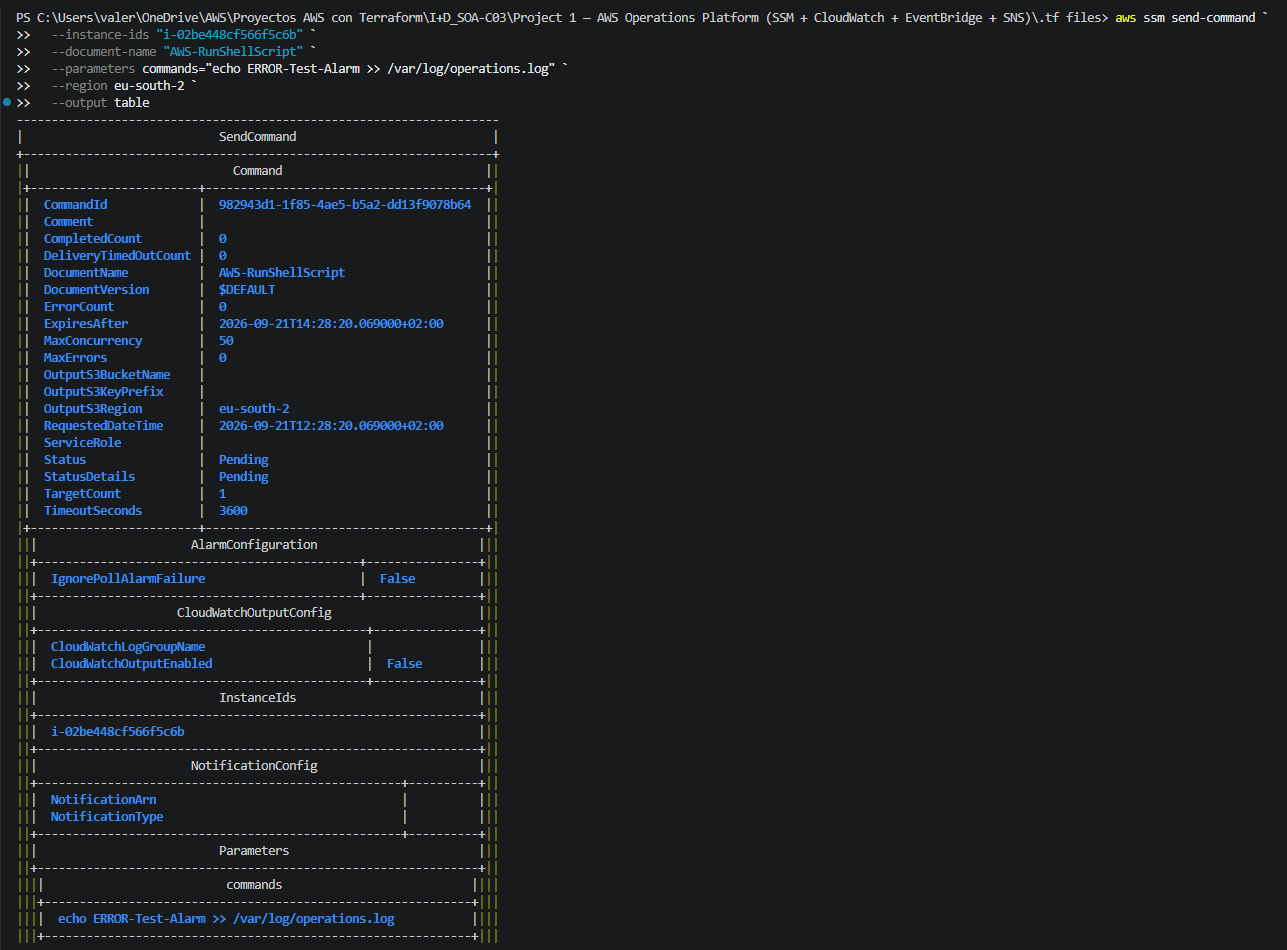
To test the alarm, a controlled error event was generated on the EC2 instance using AWS Systems Manager.
The test message was written to /var/log/operations.log, which is monitored by the CloudWatch Metric Filter.
4.3 Verify the SSM Command Execution
The SSM command invocation was checked to confirm that the test event was successfully executed on the target EC2 instance.

4.4 Confirm the Alarm State
Once the error event was detected by the metric filter, the ErrorCount metric reached the configured threshold of 1.
The CloudWatch alarm consequently changed its state to ALARM, confirming that the complete monitoring chain was working as expected.

4.5 Verify the SNS Subscription
The CloudWatch alarm is connected to an Amazon SNS topic used to distribute notifications.
The subscription was configured using an email endpoint. After creating the subscription, AWS sends a confirmation email to the configured address.
The subscription must be manually confirmed by accessing the email and clicking the confirmation link. Until this confirmation is completed, SNS will not deliver notifications to the endpoint.

4.6 Receive the Alarm Notification
Finally, the alarm state change generated an SNS notification that was delivered by email.
The message confirms that the EC2 instance changed state to stopped, demonstrating the notification mechanism used by the operations platform.

This validates the complete monitoring and notification flow:
Log Event → Metric Filter → CloudWatch Metric → CloudWatch Alarm → SNS → Email Notification
Challenges & Solutions
AWS FIS permissions : The initial FIS experiments required additional IAM permissions. The experiment role was updated to allow the required actions.
Memory monitoring : EC2 does not provide memory usage as a standard CloudWatch metric. The CloudWatch Agent was installed and configured to publish the mem_used_percent metric.
Memory stress testing : A 100% memory stress configuration in FIS does not necessarily result in exactly 100% memory usage in CloudWatch. The final value depends on the actual memory usage reported by the operating system.
Log-based monitoring : CloudWatch Metric Filters were used to detect specific error patterns in operations.log and convert them into the custom ErrorCount metric.
Alerting and notifications : The complete flow required CloudWatch Alarms, Amazon SNS, and email confirmation to work together correctly. The final tests validated the notification pipeline from the detected event to the email notification.
Project Results
- AWS operations platform focused on infrastructure monitoring and operational management.
- Automated CPU and memory stress testing using AWS Fault Injection Service (FIS).
- EC2 memory monitoring using the CloudWatch Agent.
- Centralized log monitoring with CloudWatch Logs and Metric Filters.
- Automated CloudWatch alarms for infrastructure and operational events.
- Event-driven notifications using Amazon SNS and email.
- Automated operational workflows using Amazon EventBridge and AWS Systems Manager.
- Infrastructure deployed and managed as Code using Terraform.
References
- AWS Fault Injection Service (FIS)
- Amazon EC2 Documentation
- AWS Systems Manager Documentation
- AWS Systems Manager Run Command
- Amazon CloudWatch Documentation
- CloudWatch Agent
- CloudWatch Logs
- CloudWatch Metric Filters
- CloudWatch Alarms
- Amazon EventBridge
- Amazon SNS
- AWS Identity and Access Management (IAM)
- Terraform AWS Provider
Project Code
You can find the Terraform code used in this project in the following GitHub directory.