Visualizing Insights with QuickSight
Building interactive dashboards using Amazon QuickSight and S3 datasets.
Introduction
The goal of this project was to explore Amazon QuickSight by building interactive dashboards from datasets stored in Amazon S3. The project demonstrates the complete workflow, from data ingestion to dashboard creation using Infrastructure as Code.
The objective was to understand:
- dataset ingestion
- manifest files
- dashboard creation
- interactive analytics
- infrastructure automation
This project is especially useful for:
- analytics workflows
- business intelligence
- dashboard creation
- data visualization
Services Used
The project uses the following AWS services:
- Amazon S3
- Amazon QuickSight
- Terraform
Architecture
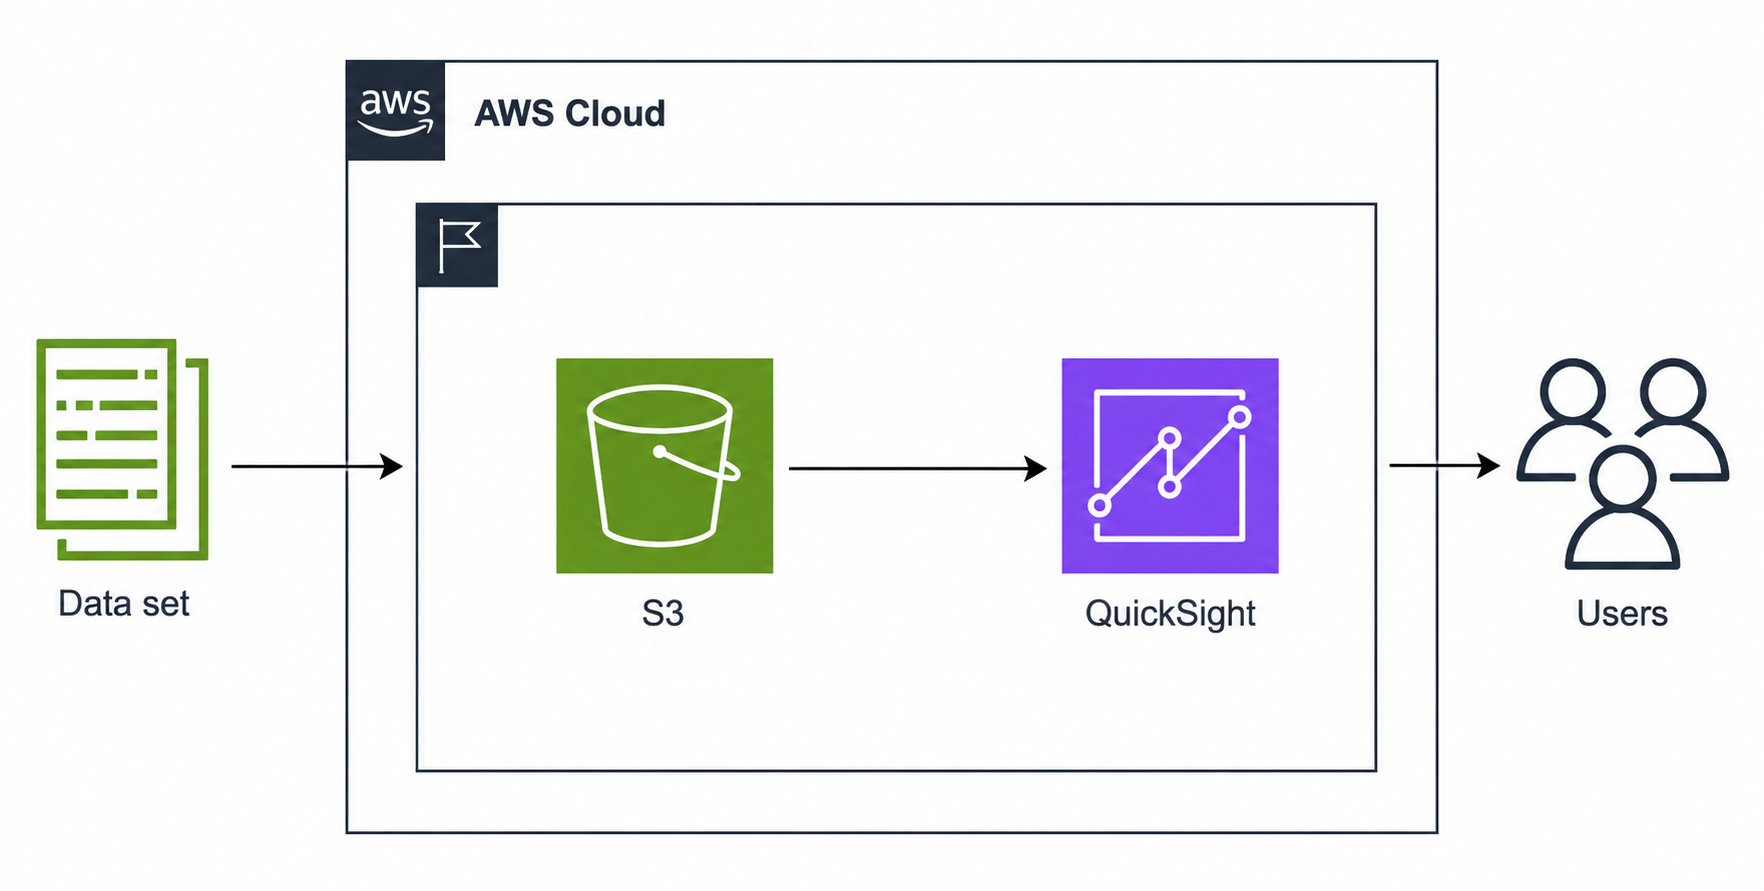
Dataset
 ↓
S3 Bucket
 ↓
Manifest File
 ↓
QuickSight
 ↓
Interactive Dashboard
Datasets are uploaded into S3 and visualized through QuickSight.
Configuration
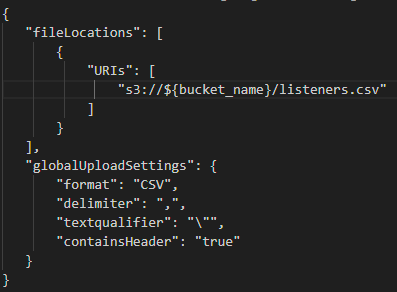
Step 1 — Manifest File
QuickSight requires a manifest file to locate and import the dataset from S3.
Terraform dynamically generated:
listeners.json.tpl
↓
listeners.json
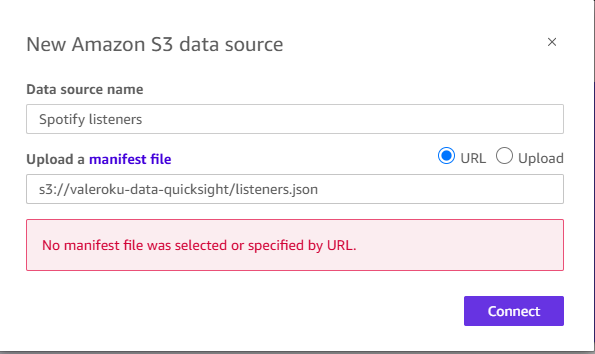
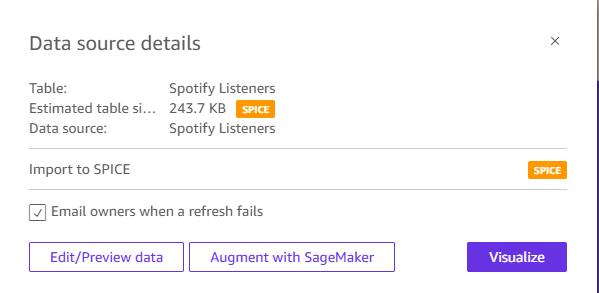
Step 2 — Create the Data Source
Create a new datasource and provide:
S3 URI
↓
Manifest File
↓
Connect
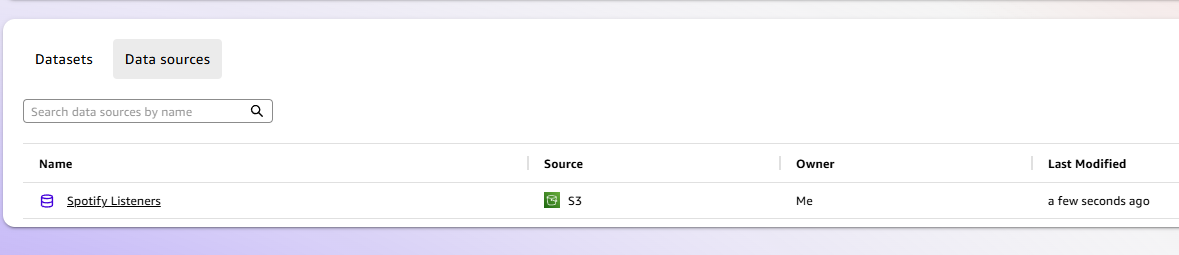
Step 3 — Dataset Creation
Once QuickSight validates access permissions, the dataset becomes available.
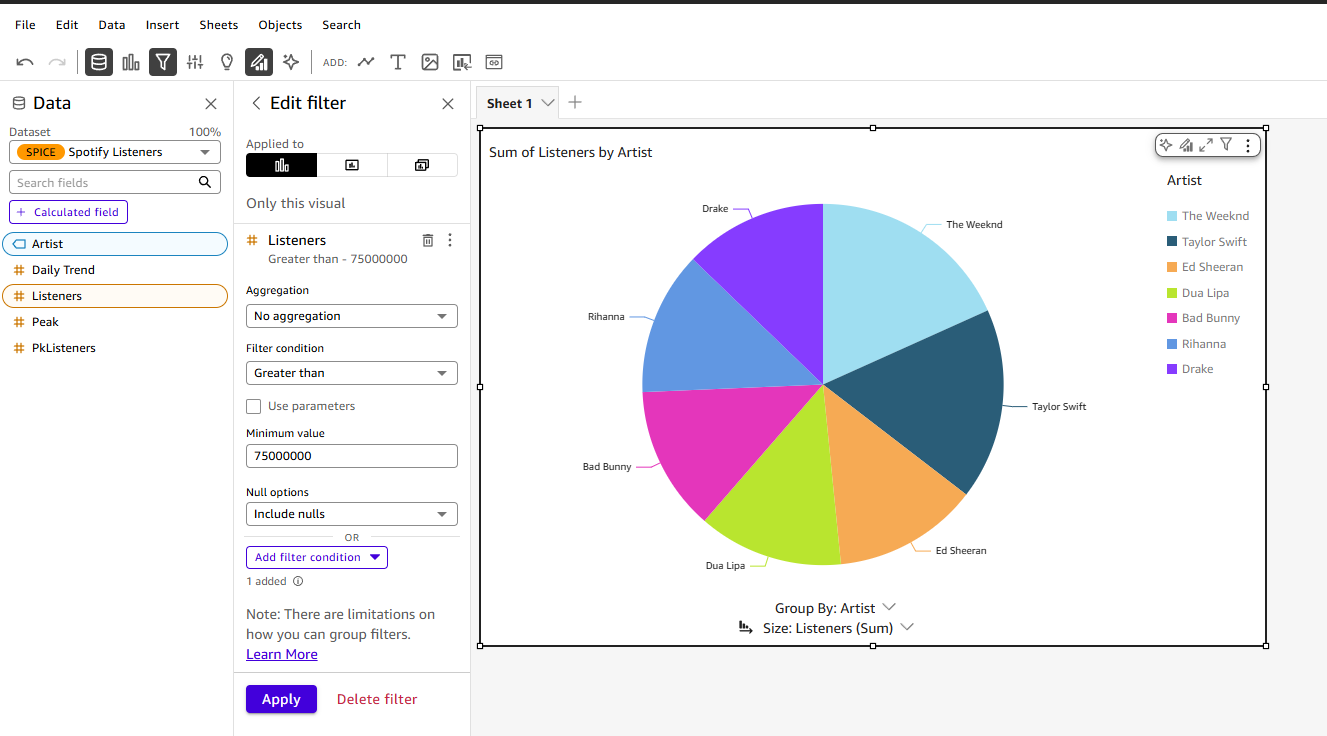
Step 4 — Data Visualization
After importing the dataset:
- select fields
- create filters
- choose visualization type
Example:
Listeners > 75,000,000
Step 5 — Interactive Dashboard
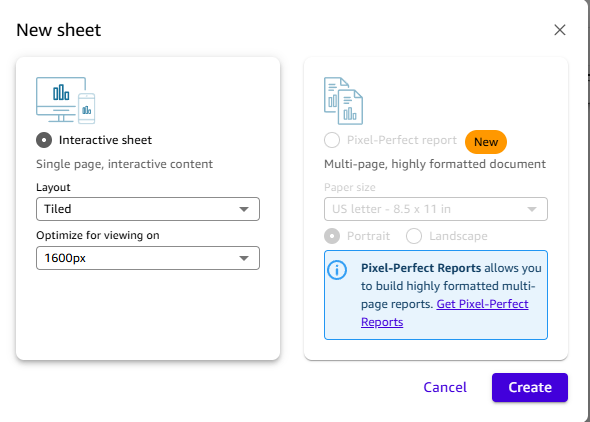
Create a new interactive sheet and configure the layout.
Important Considerations
Best practices:
- validate datasets
- automate provisioning
- secure S3 access
- optimize dashboards
- monitor performance
Lessons Learned
This project helped reinforce:
- analytics workflows
- dashboard creation
- QuickSight configuration
- dataset ingestion
- infrastructure automation
References
Project Results
This project successfully demonstrated a complete analytics workflow using Amazon QuickSight and Amazon S3.
Key outcomes:
-
Successfully stored and managed dataset files in Amazon S3 to enable scalable and reliable data access.
-
Connected Amazon QuickSight to the S3 dataset using a manifest file to create a structured data source.
-
Built interactive visualizations to analyze artist popularity based on listener metrics.
-
Demonstrated how to transform raw dataset files (CSV/JSON) into meaningful visual insights.
-
Implemented an automated infrastructure setup using Terraform to improve reproducibility and deployment efficiency.
Project Code
You can find the Terraform code used in this project in the following GitHub directory.